Project: Chemotaxis Adaptation
For this project, there are 6 tasks that you need to complete. These tasks are integrated throughout this collaboratory. You can use the navigation bar on the right to view each task.
View this page as an interactive Jupyter Notebook: click here
[DEVNOTE: Figures 1–3 & 5 are missing from original notebook.]
Introduction to Papers
Why is it that bacteria seem to know how to survive in a chemically changing environment? The answer may lie in how precisely the interactive protein networks – like those involved in survival mechanisms – are able to coordinate the responses of the living cell to react to environmental stimuli. Such preciseness in biology raises the question of how sensitive the biochemistry of these protein networks is. First, in two accompanying Nature papers, Uri Alon and N. Barkai took on the challenge to address this both experimentally and quantitatively using the Escherichia coli chemotaxis network, an ideal and well-characterized model of sensory systems at the time, published in their papers titled “Robustness in bacterial chemotaxis” (1) and “Robustness in simple biochemical networks” (2). Their work found striking results that exact adaptation is maintained in the bacteria, even with variations (increase, decrease, or mutations) of network-protein concentrations in the chemotaxis system. Another paper, “A model of excitation and adaptation in bacterial chemotaxis”(3), Spiro proposes another mathematical model that describes chemotaxis based on the kinetic properties of Tar, a key player of the network, and makes use of the methylation states which help achieve adaptation for survival. All together, these papers give intitial quantitative insights into the chemotaxis network that propelled future studies to model this simple, yet precise signaling network.
What is Chemotaxis?
Comic by Noemie Matthey
Figure 1. Chemotaxis Network (Alon et al.)
Bacterial chemotaxis is defined as the movement of bacteria in response to chemical stimuli in the environment. Examples of such response include moving to a higher concentration of food source (glucose) or fleeing from toxins (phenol) (3). The movement associated with the cell’s swimming direction involves controlling the flagella and the frequent, abrupt changes in direction, known as tumbles. Bacteria chemotaxis also is known for being exact in adapting to changes in the environment. For example, a change in concentration of a chemical in the bacteria’s environment induces rapid changes in the tumbling frequency, enabling the bacteria to swim either away from the chemical (repellent) or towards it (attractant). Chemotaxis has been a widely studied system by scientists due to its remarkably sensitivity to small, relative changes in the concentrations of multiple chemical signals over a broad range of ambient concentrations.
Task 1: The Basics of the Chemotaxis Network
Label the chemotaxis system with the appropriate protein names and describe their main functions. Also, define the main biochemical interactions in the signaling pathway.
Methylation:
Phosphorylation:
Tar:
CheA:
CheW:
CheY:
CheZ:
CheR:
CheB:
Membrane-spanning chemoreceptors (aspartate receptor Tar) transduce signals into the cells upon activation. These consist of protein kinases CheA and CheW. CheA phosphorylates itself and transfers phosphoryl ground to a messenger protein, CheY. Upon phosphorylation, active CheY interacts with the flagellar motors and induces tumbling, and thus cellular movement. To slow down movement, CheY is dephosphorylated by CheZ. Methylation of the chemoreceptors influences the adaption changes the cell undergoes by increasing the rate of CheY phosphorylation. Methyl groups are modified by enzymes CheR and CheB.
Task 2: The Spiro Model
Figure 3. The Spiro Model (Spiro et al.)
The Spiro model describes a mathematical model based on known kinetic properties of Tar and the phosphorelay signaling components. It also makes use of the multiple methylation states to achieve adaptation.
List assumptions of the Spiro Model:
Tar receptor always forms a complex with CheA and CheW
CheW functions as an adapter (scaffolding) protein and has no enzymatic function
The complex has two phosphorylation states, three methylation states, and ligand bound or unbound state
Operate at low concentrations of external ligand so that only the low methylation states will be relevant
Only have to consider two methylation states
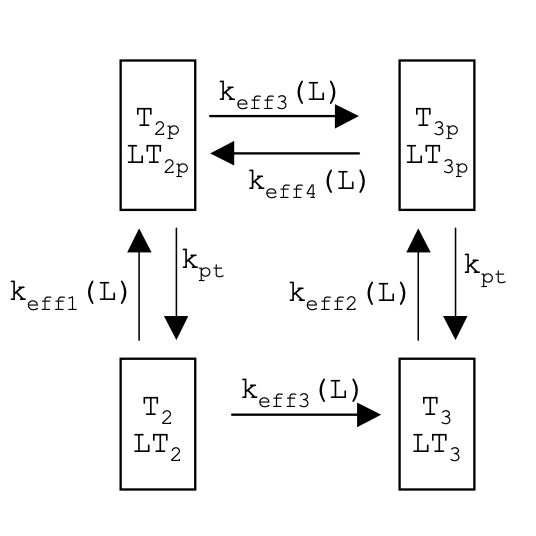
Below is a framework of a simplified version of Spiro’s model (4). Using the definitions of rate constants listed in Table 3 from the paper, fill in the missing sections using the following terms:
T2p
LT2p
T3p
LT3p
T3
LT3
keff1
keff2
keff3
keff4
kpt
ANSWER:
Figure 4. Simplified version of Spiro’s model
Task 3: The Barkai Model
Figure 5. The Barkai Model (The two-state model of chemotaxis) (Barkai et al.)
There are three main assumptions of the Barkai Model that differ from the Spiro. What are these?
Assumption 1:
Assumption 2:
Assumption 3:
ANSWER: 1. CheB only demethylates phosphorylated (‘active’) receptors 2. methylation rates operate at saturation since [CheR] is much smaller than the concentration of receptors 3. demethylation is independent of ligand binding
Below is a framework of a simplified version of Barkai’s model (4). Using the assumptions above, fill in the missing sections using the following terms:
T2p
LT2p
T3p
LT3p
T3
LT3
keff1
keff2
keff3
keff4
kpt
ANSWER:
Using the assumption stated by Barkai about enzyme kinetics in saturation, fill in the missing sections of an even further simplified model using the following terms:
rin
kpt
T3p
LT3p
ANSWER:
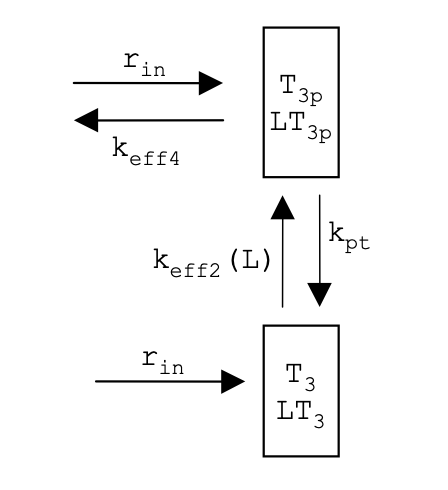
What is rin?
ANSWER: the saturated methylation rate that is independent of [2] and [2p]
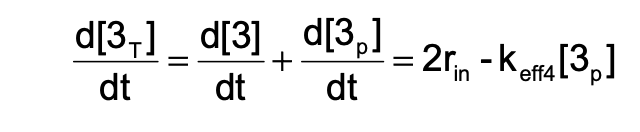
Derive the equations for \(\frac{d3p}{dt}\), \(\frac{d3}{dt}\), and \(\frac{d3T}{dt}\):
\(\frac{d3p}{dt} = \text{ ?}\)
\(\frac{d3}{dt} = \text{ ?}\)
\(\frac{d3T}{dt} = \text{ ?}\)
ANSWER:
Task 4: Robustness and Perfect Adaptation
Barkai argued that a few key features of chemotaxis network are robust, meaning that they are insensitive to the precise values of the biochemical parameters.
Adaptation in chemotaxis means that the bacteria can “adapt back” to the pre-stimulus tumbling frequency value, regardless of how much the concentration of the chemical stimulant changed. This is really handy for the bacteria, as it allows them to either rapidly swim away from the repellent, or swim toward the attractant, and go back to continiuing to survive in this fashion.
Perfect adaption refers to the dependence between number of phosphorylated receptors and the ligand concentration in steady state. More specifically, the number of phosphorylated receptors is independent of the ligand concentration.
Barkai’s model can be modified to show robust adaptation mechanism in the figure below. It also does not require tine-tuning to obtain perfet adaptation. (Note that the rate of reverse modification does not depend on the concentration of Em)
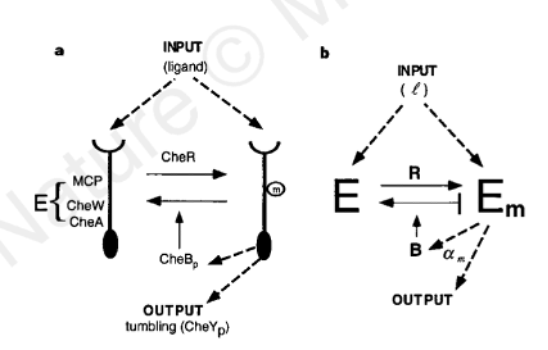
Figure 6. The Barkai Model of Robust Mechanism (Barkai et al.)
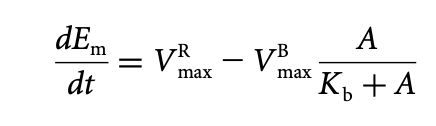
Derive an equation for \(\frac{dEm}{dt}\) (the rate of change of the reverse-modification reaction) as a function of the activity, A, from the model in (b). Use the following hints:
The system is adaptive when its steady-state activity, Ast, is independent of l
A mechanism for robust adaptation can be obtained when the rates of the modification and the reverse-modification reactions depend on the system activity, A, not on the concentrations Em and E
Enzyme R catalyses the modification reaction E → Em and works at saturation
Enzyme B catalyses the reverse-modification reaction Em → E and can only bind to active enzymes
Modification rate is constant at all times
Assume Michaelis-Menten kinetics
ANSWER:
Task 5: Coding the Chemotaxis Model
Complete a Python script for the Chemotaxis Model. It has been partially completed for you. Use the comments as a guide for completing the missing parts.
################################################################################
# Project Title: Chemotaxis Network
# Author:
# Description: This code uses the initial conditions and kinetic rates
#to calculate the methylation and phosphorylation levels of a chemotaxis model by Spiro et al.
################################################################################
import numpy as np # import data structuring
from scipy.integrate import odeint # import ODE integrating function
import matplotlib.pyplot as plt # import plotting libraries
import math as m # import math operations
################################################################################
#Define constants from Table 3 (Spiro et al.)
#Use units: M (molar concentration), s (seconds)
k1c = 0.17 #1/s
k3c = 30 * k1c #1/s
ratiok1bk1a = 1.7e-6
ratiok3ck3a = 1.7e-6
k_1 = 4e5 #1/(Ms)
k_3 = k_1 #1/(Ms)
k8 = 15 #1/s
k9 = 3 * k8 #1/s
k11 = 0 #1/s
#k12=1.1*k8 #1/s
k12 = 30
kb = 8e5 #1/(Ms)
ky = 3e7 #1/(Ms)
k_b = 0.35 #1/s
k_y = 5e5 #1/(Ms)
Kbind = 1e6 #1/M association constant for ligand binding (Kb)
Yo = 20e-6 #M
Bo = 1.7e-6 #M
To = 8e-6 #M
Ro = 0.3e-6 #M
Zo = 40e-6 #M
t = np.linspace(0,80,500)
cligand = 1e-6 #ligand concentration (L)
#From Simplified Model:
#[T2]+[LT2] = y[0]
#[T3]+[LT3] = y[1]
#[T2p]+[LT2p] = y[2]
#[Bp] = y[3]
#[Yp] = y[4]
#Define initial conditions
To = 8e-6
Yo = 20e-6 #initial concentration of CheY
Bo = 1.7e-6 #initial concentration of CheB
y0 = [4e-6, 4e-6, 0e-6, 0.5e-6, 10e-6]
Vmaxunbound = k1c * Ro #maximum turnover rate (MM kinetics) for unbound receptors
Vmaxbound = k3c * Ro #maximum turnover rate (MM kinetics) for bound receptors
KR = ratiok1bk1a #Michaelis constant
fb = Kbind * cligand / (1 + Kbind * cligand) #fraction receptors bound to ligand
fu = 1 - fb #fraction receptors not bound to ligand
#def model(y,t,ky,k8,k9,fu,k_3,Vmaxunbound,Vmaxbound,KR,fb,To,Bo,k1c,k3c,ratiok1bk1a,ratiok3ck3a,k_1,k11,k12,kb,k_b,k_y,Kbind,Yo,Ro,Zo,cligand): #define model for differential equations
def model(y,t,ky,k8,k9,fu,k_3,Vmaxunbound,Vmaxbound,KR,fb,To,Bo,cligand):
if t > 20:
cligand = 1e-3
if t > 50:
cligand = 1e-6
Vmaxunbound = k1c * Ro #maximum turnover rate (MM kinetics) for unbound receptors
Vmaxbound = k3c * Ro #maximum turnover rate (MM kinetics) for bound receptors
KR = ratiok1bk1a #Michaelis constant
fb = Kbind * cligand / (1 + Kbind * cligand) #fraction receptors bound to ligand
fu = 1 - fb #fraction receptors not bound to ligand
kpt = ky * (Yo - y[4]) + kb * (Bo - y[3])
ydot1 = (-k8 * fu - k11 * fb) * y[0] + kpt * y[2] + (k_1 * fu + k_3 * fb) * y[1] * y[3] - Vmaxunbound * y[0] * fu / (KR + y[0] * fu) - Vmaxbound * y[0] * fb / (KR + y[0] * fb)
ydot2 = (-k9 * fu - k12 * fb) * y[1] + kpt * (To - y[0] - y[1] - y[2]) - (k_1 * fu + k_3 * fb) * y[1] * y[3] + Vmaxunbound * y[0] * fu / (KR + y[0] * fu) + Vmaxbound * y[0] * fb / (KR + y[0] * fb)
ydot3 = (k8 * fu + k11 * fb) * y[0] - kpt * y[2] + (k_1 * fu + k_3 * fb) * (To - y[0] - y[1] - y[2]) * y[3] - Vmaxunbound * y[2] * fu / (KR + y[2] * fu) + Vmaxbound * y[2] * fb / (KR + y[2] * fb)
ydot4 = kb * (To - y[0] - y[1]) * (Bo - y[3]) - k_b * y[3]
ydot5 = ky * (To - y[0] - y[1]) * (Yo - y[4]) - k_y * y[4] * Zo
return [ydot1, ydot2, ydot3, ydot4, ydot5]
#Solve differential equations with odeint function
soln = odeint(model,y0,t,args=(ky,k8,k9,fu,k_3,Vmaxunbound,Vmaxbound,KR,fb,To,Bo,cligand))
#Calculate results for graphs
Ptot = To - soln[:, 0] - soln[:, 1] #total phosphorylation level
Bp = soln[:, 3] #CheB phosphorylation
Yp = soln[:, 4] #CheY phosphorylation
metlevel = 1 - (soln[:, 0] + soln[:, 2]) / To #Methylation level
phoslevel = 1 - (soln[:, 0] + soln[:, 1]) / To #Phosphorylation level
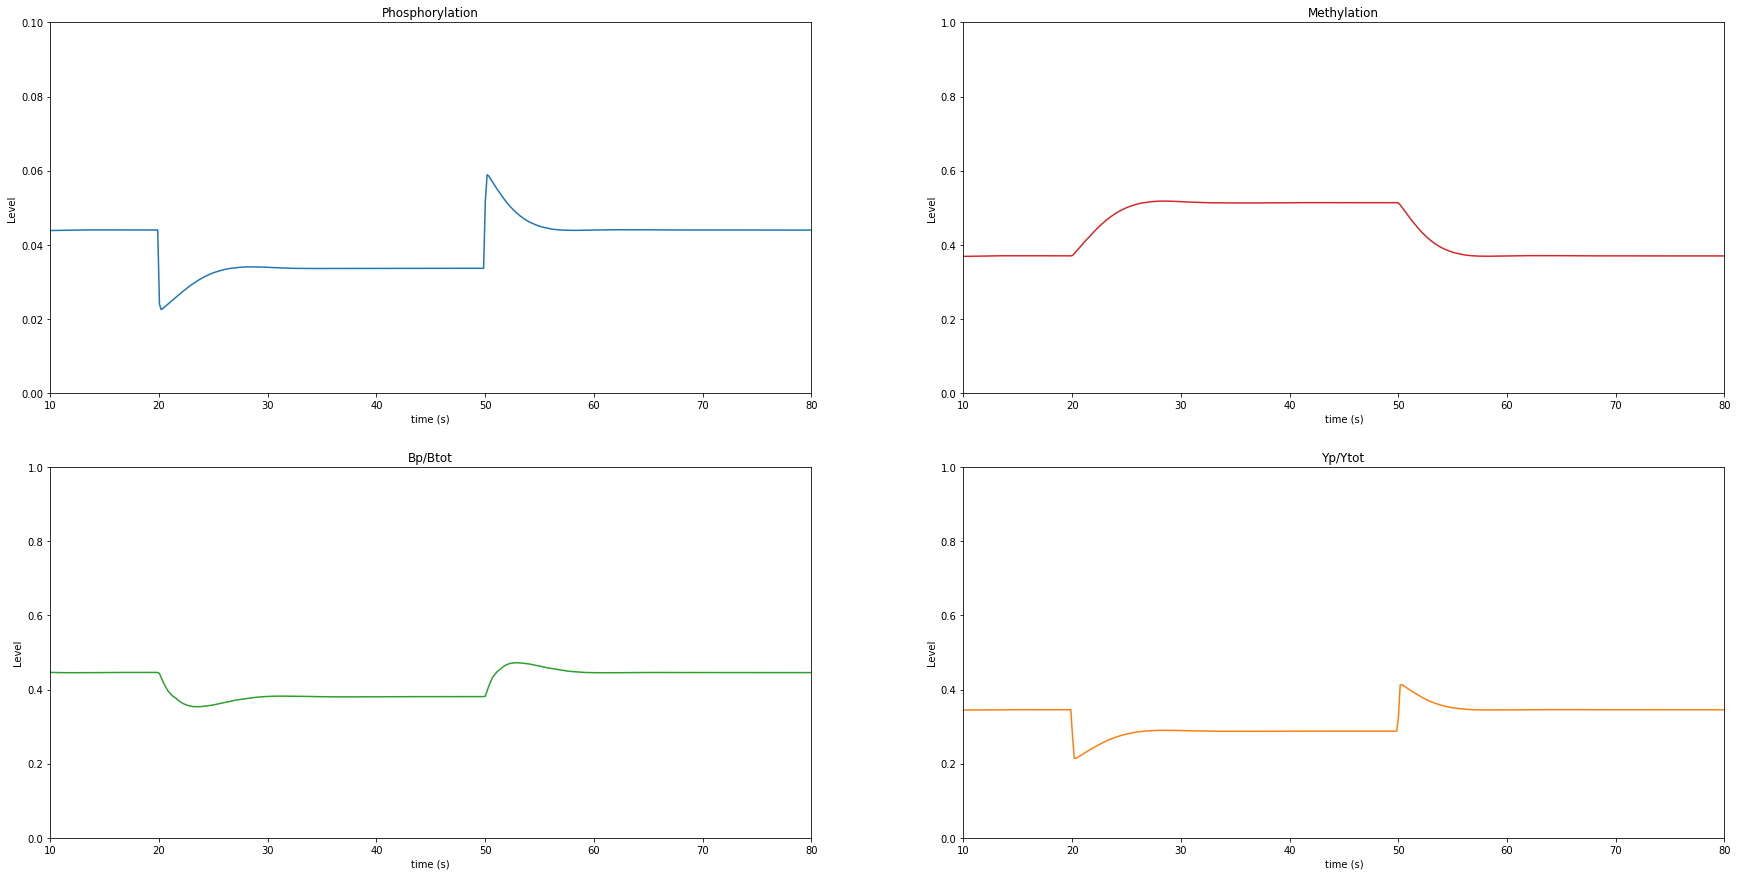
#Graphs for output
fig, axes = plt.subplots(2, 2, figsize=(30,15))
axes[0, 0].plot(t, phoslevel, 'tab:blue')
axes[0, 0].set_title('Phosphorylation')
axes[0, 0].set_xlim([10, 80])
axes[0, 0].set_ylim([0, 0.1])
axes[0, 1].plot(t, metlevel, 'tab:red')
axes[0, 1].set_title('Methylation')
axes[0, 1].set_xlim([10, 80])
axes[0, 1].set_ylim([0, 1])
axes[1, 0].plot(t, Bp/Bo, 'tab:green')
axes[1, 0].set_title('Bp/Btot')
axes[1, 0].set_xlim([10, 80])
axes[1, 0].set_ylim([0, 1])
axes[1, 1].plot(t,Yp/Yo, 'tab:orange')
axes[1, 1].set_title('Yp/Ytot')
axes[1, 1].set_xlim([10, 80])
axes[1, 1].set_ylim([0, 1])
for ax in axes.flat:
ax.set(xlabel='time (s)', ylabel='Level')
Task 6: Modeling Perfect Adaptation
Vary the values of k11 and k9 and write down the observations you see in the graphical outputs. What happens to phosphorylation and methylation when k11 > k9? When k11 < k9?
Conclusions
Write down your conclusions from the notebook.
BONUS: Describe any advancements from these papers that more recent studies on the chemotaxis system have discovered.
References
Alon, U., Surette, M., Barkai, N. et al. Robustness in bacterial 168–1chemotaxis. Nature 397, 168–171 (1999). https://doi.org/10.1038/16483
Barkai, N., Leibler, S. Robustness in simple biochemical networks. Nature 387, 913–917 (1997). https://doi.org/10.1038/43199
Spiro, P. A., Parkinson, J. S., & Othmer, H. G. (1997). A model of excitation and adaptation in bacterial chemotaxis. Proceedings of the National Academy of Sciences of the United States of America, 94(14), 7263–7268. https://doi.org/10.1073/pnas.94.14.7263
Oudenaarden, A. V. (2009, October). VIII Modeling Escherichia coli chemotaxis. Lecture. Retrieved November, 2020, from http://web.mit.edu/biophysics/sbio/PDFs/L11_notes.pdf
Other recommended sources:
Bren, A., & Eisenbach, M. (2000). How signals are heard during bacterial chemotaxis: protein-protein interactions in sensory signal propagation. Journal of bacteriology, 182(24), 6865–6873. https://doi.org/10.1128/jb.182.24.6865-6873.2000
Falke, J. J., Bass, R. B., Butler, S. L., Chervitz, S. A., & Danielson, M. A. (1997). The two-component signaling pathway of bacterial chemotaxis: a molecular view of signal transduction by receptors, kinases, and adaptation enzymes. Annual review of cell and developmental biology, 13, 457–512. https://doi.org/10.1146/annurev.cellbio.13.1.457
Alon, U., Camarena, L., Surette, M. G., Aguera y Arcas, B., Liu, Y., Leibler, S., & Stock, J. B. (1998). Response regulator output in bacterial chemotaxis. The EMBO journal, 17(15), 4238–4248. https://doi.org/10.1093/emboj/17.15.4238
Staropoli JF, Alon U. Computerized analysis of chemotaxis at different stages of bacterial growth. Biophys J. 2000 Jan;78(1):513-9. doi: 10.1016/S0006-3495(00)76613-6. PMID: 10620314; PMCID: PMC1300658.